Contextualizing Data
Part of the Ecology Disrupted Curriculum Collection.
DOWNLOADS
Contextualizing Data teacher's guide
TEACHER'S GUIDE
Discussion
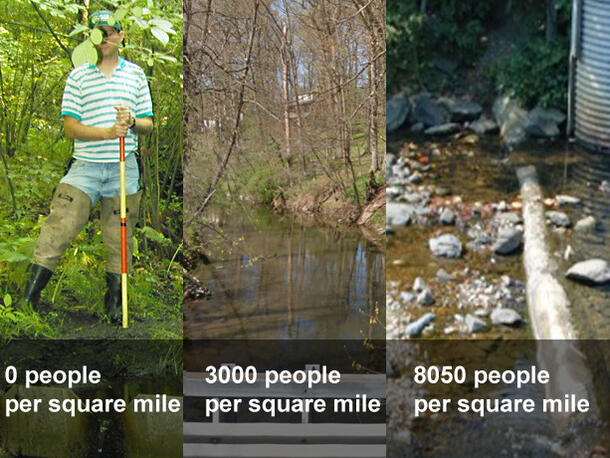
Key Idea: Dr. Sujay Kaushal chose to compare urban, suburban, and forested streams to gauge human impact on streams.
Question: Why was it important to incorporate the benchmarks and population densities of the different areas onto the graphs?
Answer: The benchmarks are a way to contextualize the salt levels in the Baltimore area with other salt levels. The population densities show how many people live and drive in the area, which has a direct relationship to how many roads there are and therefore how much salt enters area waterways.
Note: Remind students that NYC has a much higher population density (26.403 people/mile2) than Baltimore.