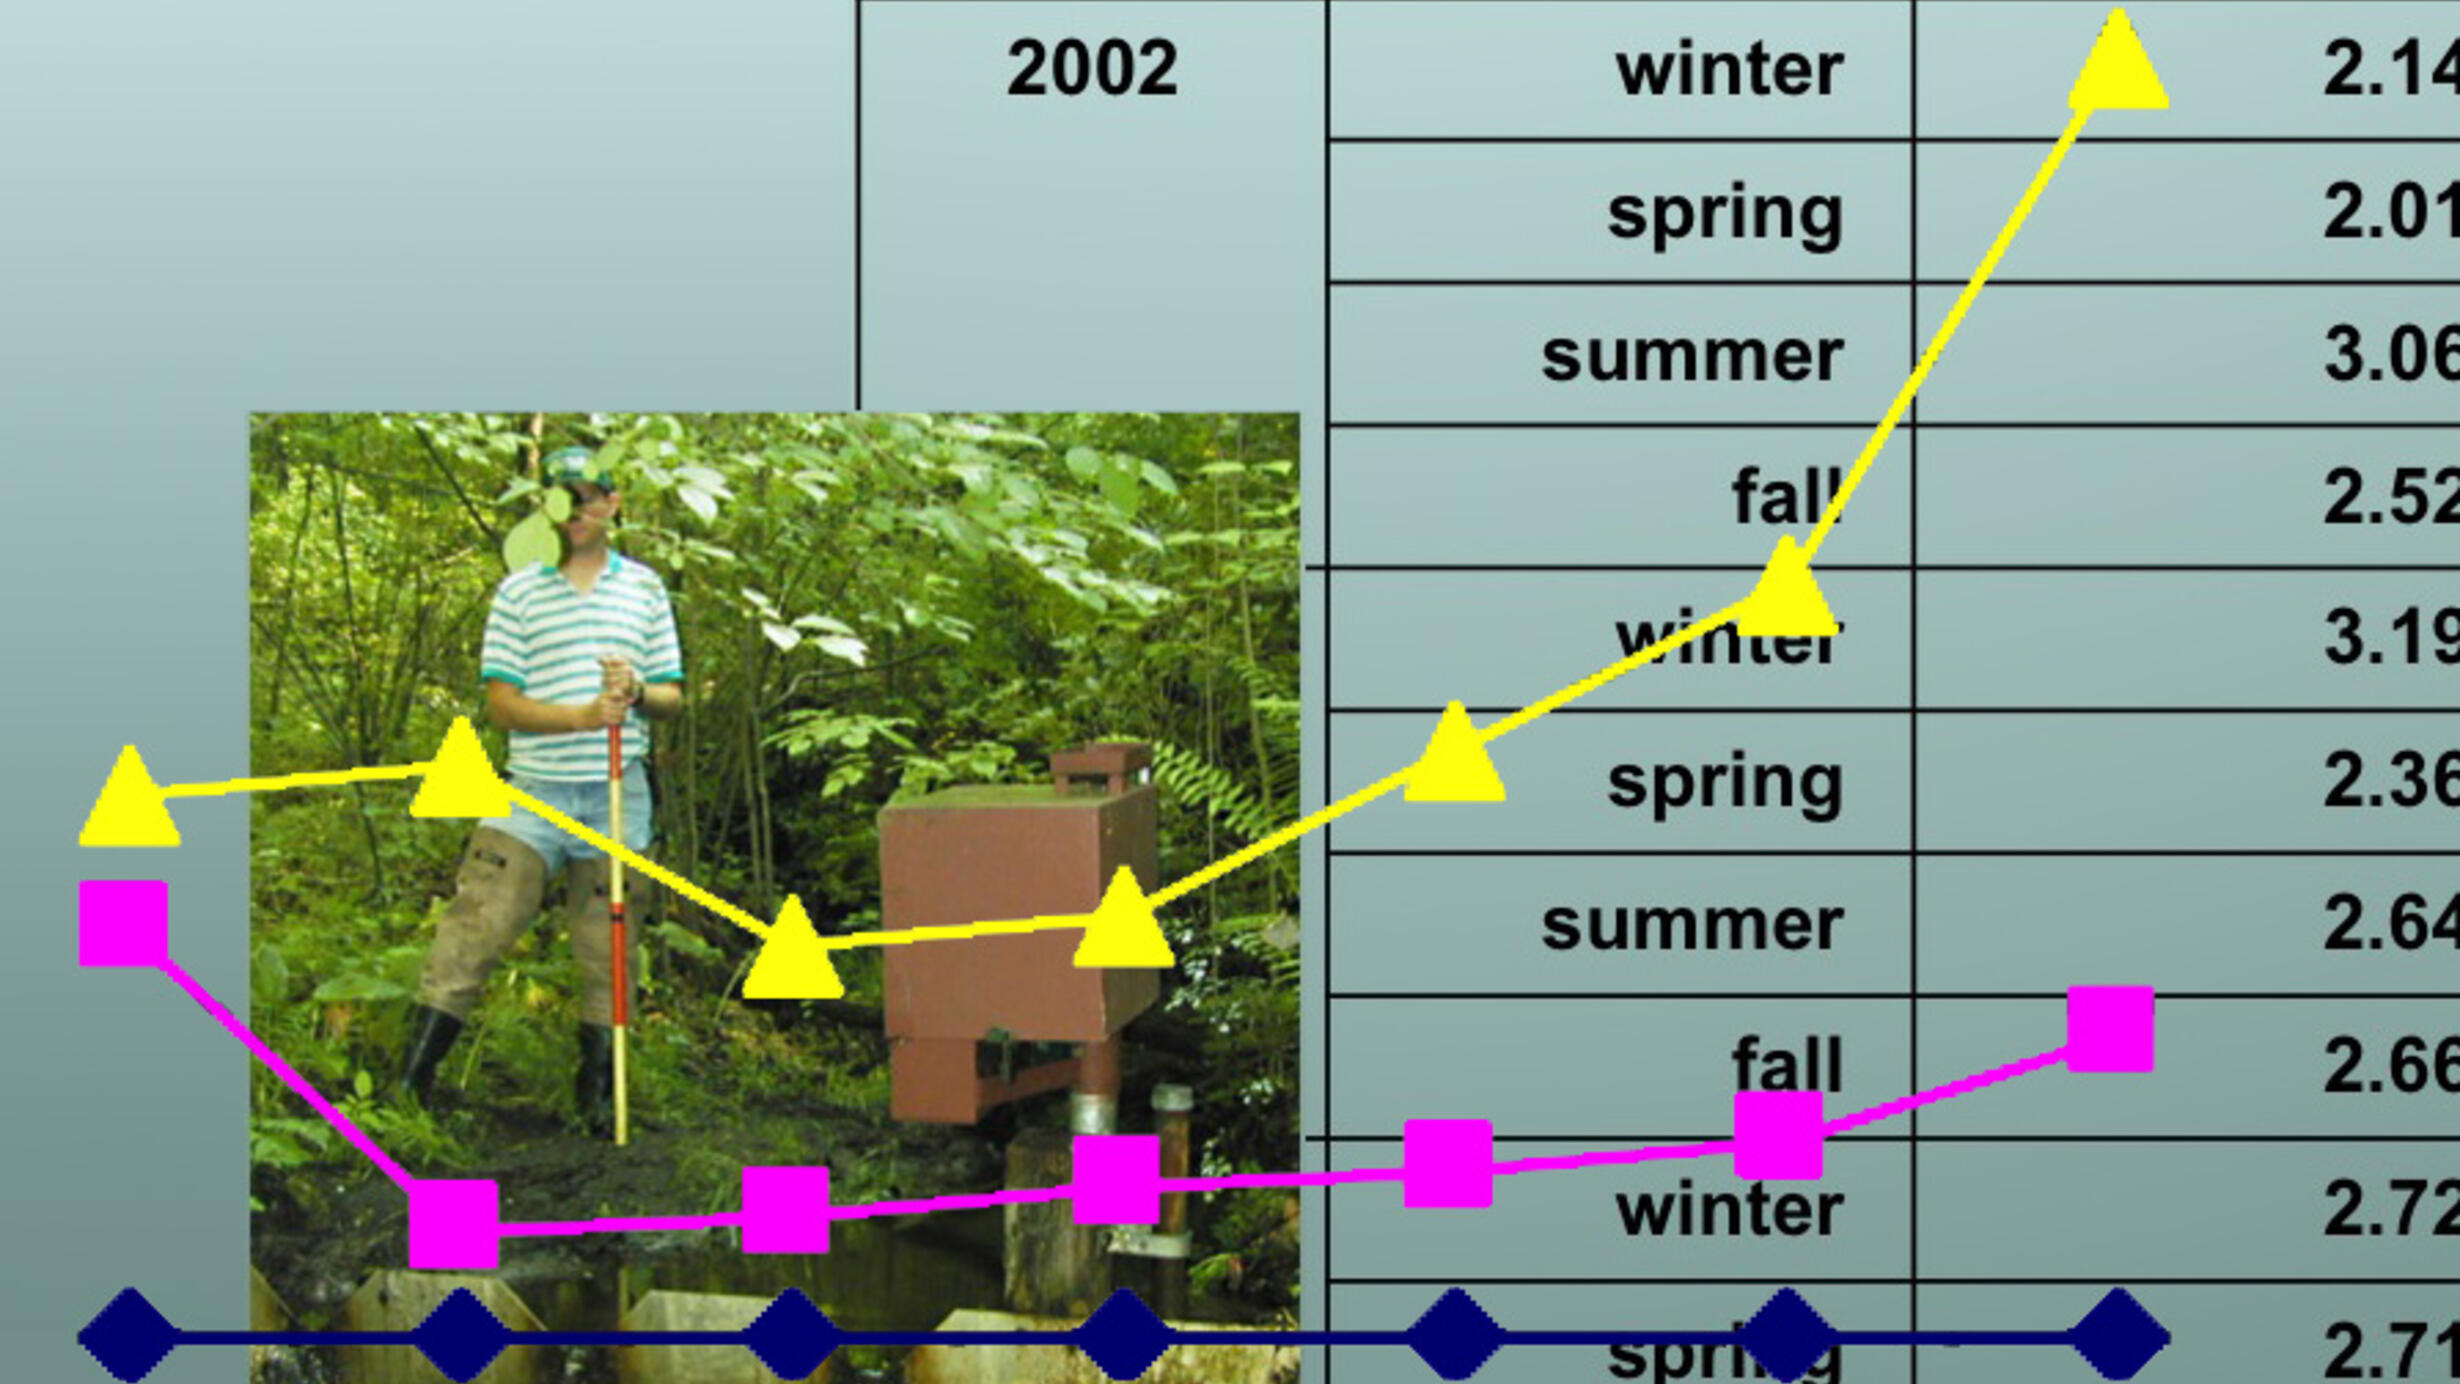
Representing and Making Meaning from Salinity Data: Graphing and Drawing Conclusions

Part of the Ecology Disrupted Curriculum Collection.

representing data main image

DOWNLOADS

Making Meaning from Data lesson plan

PDF
DOC

Making Meaning from Data investigation booklet

PDF
DOC

LESSON PLAN

(Time required: about 45 minutes)

1. Students continue to graph data from the previous lesson (20 minutes)

2. Discuss the importance of adding benchmarks like EPA drinking water salt guidelines and population densities to the graphs (5 minutes)

3. Compare graphs, and use the data to make conclusions about Baltimore’s water supply and road salt. (8 minutes)

4. Generalize from the Baltimore data to apply conclusions to your city’s water supply. (5 minutes)

5. Complete the Representing and Making Meaning from Data section of the Investigation Booklet. (7 minutes)

Summary/Assessment:  Ask students to complete the Representing and Making Meaning from Data section of the Investigation Booklet, available in the Downloads section on this page.