Graphing Analysis of Algae and Oysters: Comparing Historic to Modern Day Levels
Part of the Ecology Disrupted Curriculum Collection.
DOWNLOADS
Download the files below to use offline, or to incorporate into your own lesson planning tools.
Graphing Analysis template
Graphing Analysis worksheet
Chesapeake Bay teacher's guide
TEACHER'S GUIDE
The students must graph the oyster and floating algae to sea floor algae ratio levels and use the worksheet to analyze their results.
1. The students must graph the oyster and floating algae to sea floor algae ratio levels and use the worksheet to analyze their results.
This is a difficult graphing activity:
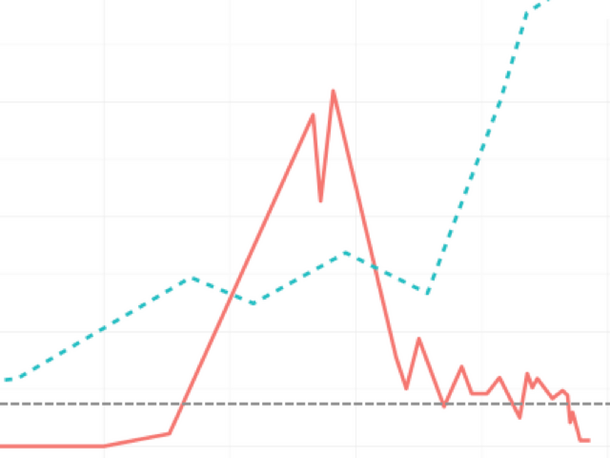
The graphs have two Y-axes each with the same scale (0-8).
a. To get the true number of oysters caught or landed the values plotted need to be multiplied by 105 metric tons (i.e. hundreds of thousands of metric tons).
b. The for nutrient level is a ratio that measures the ratio of floating algae to sea floor algae found today and historically – This is a side note, but greater nutrient levels in the water lead to more floating algae and less sea floor algae because the sun is blocked by the floating algae.
c. The same scale is used for both the oyster catch and the floating algae to seafloor algae ratio, since the range for the oyster catch is 1-7 hundred thousand metric tons, and the range for floating algae to sea floor algae ranges from 1 to 8. This may be a good place to help students visualize how much a metric ton is: for example, a school bus is almost 12 metric tons and a blue whale is 170 metric tons. So in a year when people harvested 500,000 metric tons of oysters, they removed the equivalent of more than 40,000 school buses or 3000 blue whales from the Chesapeake.
d. The X-axis includes data from 1700 onward, which is the earliest date for which we have much information about oyster harvesting. However, the floating algae to seafloor algae ratio data go back much further. To show this, we have added a benchmark to the graph
2. After students complete their graph, ask students to complete the accompanying worksheet.
One point emphasized in the worksheet is that floating algae begin to increase even before oyster harvesting begins. This is a record of the initial impact of farming by European settlers on the Bay due to the greater input of nutrients into the Bay from land clearing caused soil runoff. Nutrient pollution from farming in the Chesapeake region began to affect floating algae early on, and then oyster harvesting made the problem substantially worse. When those tasks are complete, ask the students to complete a summary worksheet of the activity.