Comparing Graphs, Making Conclusions
Part of the Ecology Disrupted Curriculum Collection.
DOWNLOADS
Comparing Graphs, Making Conclusions teacher's guide
TEACHER'S GUIDE
Reintroduce the guiding question, “How might snowy and icy roads affect Baltimore’s water supply” before asking students to begin comparing their graphs.
Discussion
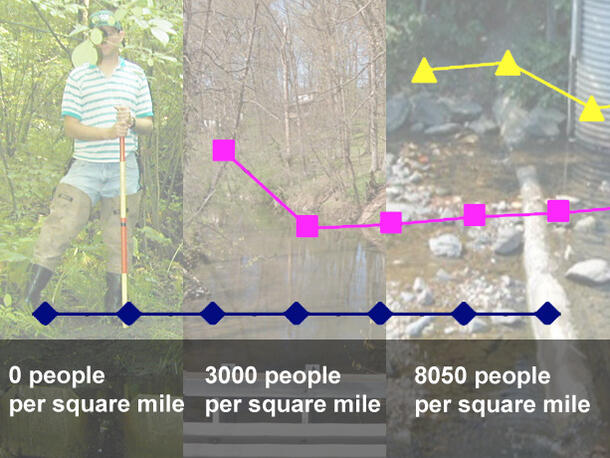
Key Idea: The amount of salt people added into freshwater ecosystems depends upon population density and number of roadways.
Recall that we began with the question, “How might snowy and icy roads affect the Baltimore area’s water supply?” We thought that road salt would make its way into streams during winter months, and that we’d find more salt in streams near roads during snowier weather. We graphed the actual datasets that Dr. Kaushal analyzed. Now it is time to start drawing conclusions by looking for patterns in the data.
Question: What patterns do you see?
Answers: Seasonal pattern (more salt in water in the winter) Location pattern (more salt in urban areas than suburban or forested areas).
Question: What conclusions can you make from these patterns?
Answer: Salt put on roadways to melt snow and ice enters area streams making the water salty. The areas with the highest population density and the most roads have streams with the highest salt content.
Question: What are some consequences of salt entering the water supply of Baltimore on living things?
Answers: At 226 mg/L freshwater animals and plants will begin to die, at 400 mg/L some frogs will die, and at 1,000 mg/L freshwater fish like rainbow trout will die. Organisms that eat small plants and animals will also be affected because the food they eat will no longer be available.