Join Carter Emmart, the Museum’s director of astrovisualization, and Leila Mays, deputy director of the Community Coordinated Modeling Center at NASA Goddard, to explore how scientists protect astronauts from space weather and why our Sun’s dynamic activity affects human space travel. Bring your questions for our presenters and for Kathryn Whitman and Phil Quinn of NASA Johnson Space Center's Space Radiation Analysis Group (SRAG), and Jon Linker of Predictive Science, Inc., who will be answering your questions live in the chat.
Emilie Ho and Christian Adamsson from Linköping University pilot our up-close encounter with powerful solar storms and eruptive solar flares in the OpenSpace platform.
Watch a recording of the livestream below, first aired on October 2, 2020. Or check out the complete playlist of Astronomy Online events.
CARTER EMMART (Director of Astrovisualization): And so I'd like to now introduce our guide today, my co-host, who is going to guide us through this, is Dr. Leila Mays. She's a solar astrophysicist. Leila.
LEILA MAYS (Astrophysicist, NASA's Goddard Space Flight Center): Hi, Carter. Nice to see you. I'm really excited to be working with you and presenting the show again.
EMMART: Yes, because we've done it before. We've done a couple at the museum programs.
MAYS: Yes. Yes. And before we get started, I wanted to let everybody know that this show is created by support from the National Science Foundation. The science results were supported by the National Science Foundation, NASA and the Air Force Office of Space Scientific Research.
And we're going to be working-- we're going to be showing you this program today with our two master students from Linkoping University. So I'm going to introduce them now. Emilie Hu and Christian Adamsson. They will be our pilots, flying us through the universe with Open Space. We've been working with each other virtually, remotely, for the last six months. And they have brought these simulations to life. So Carter, I'm going to pass it back to you to get it started.
EMMART: Wonderful. Thank you, Leila. And we're just going to start off with Open Space here. And we see the Earth. We're going to show you a cloudless Earth. You see Africa. We're also going to see the cursor, because our students, Emilie and Christian, will be guiding us. Emilie is flying us, actually, right now. And so we're looking at the Earth from space. And so you see the stars in the background.
And I can ask, Emilie, could we bring up the International Space Station orbit please? And when we do, we're going to see a thin line. And this is where we've been flying. This is where the space shuttle flies. After we left the moon in 1972, almost 50 years ago, we had Skylab, and then we had the space shuttle, and other countries, like Russia, had space stations, and they all fly basically a few hundred kilometers off the earth. And that's where we have been since going to the moon. Well, how far away is the moon?
I'd like to back away from the Earth here. And as we do, we're going to bring up an illustration, data visualization. So when I talk about-- something that we don't see with our eyes. It's beyond what we can see visibly. But we can calculate it, and we can draw it.
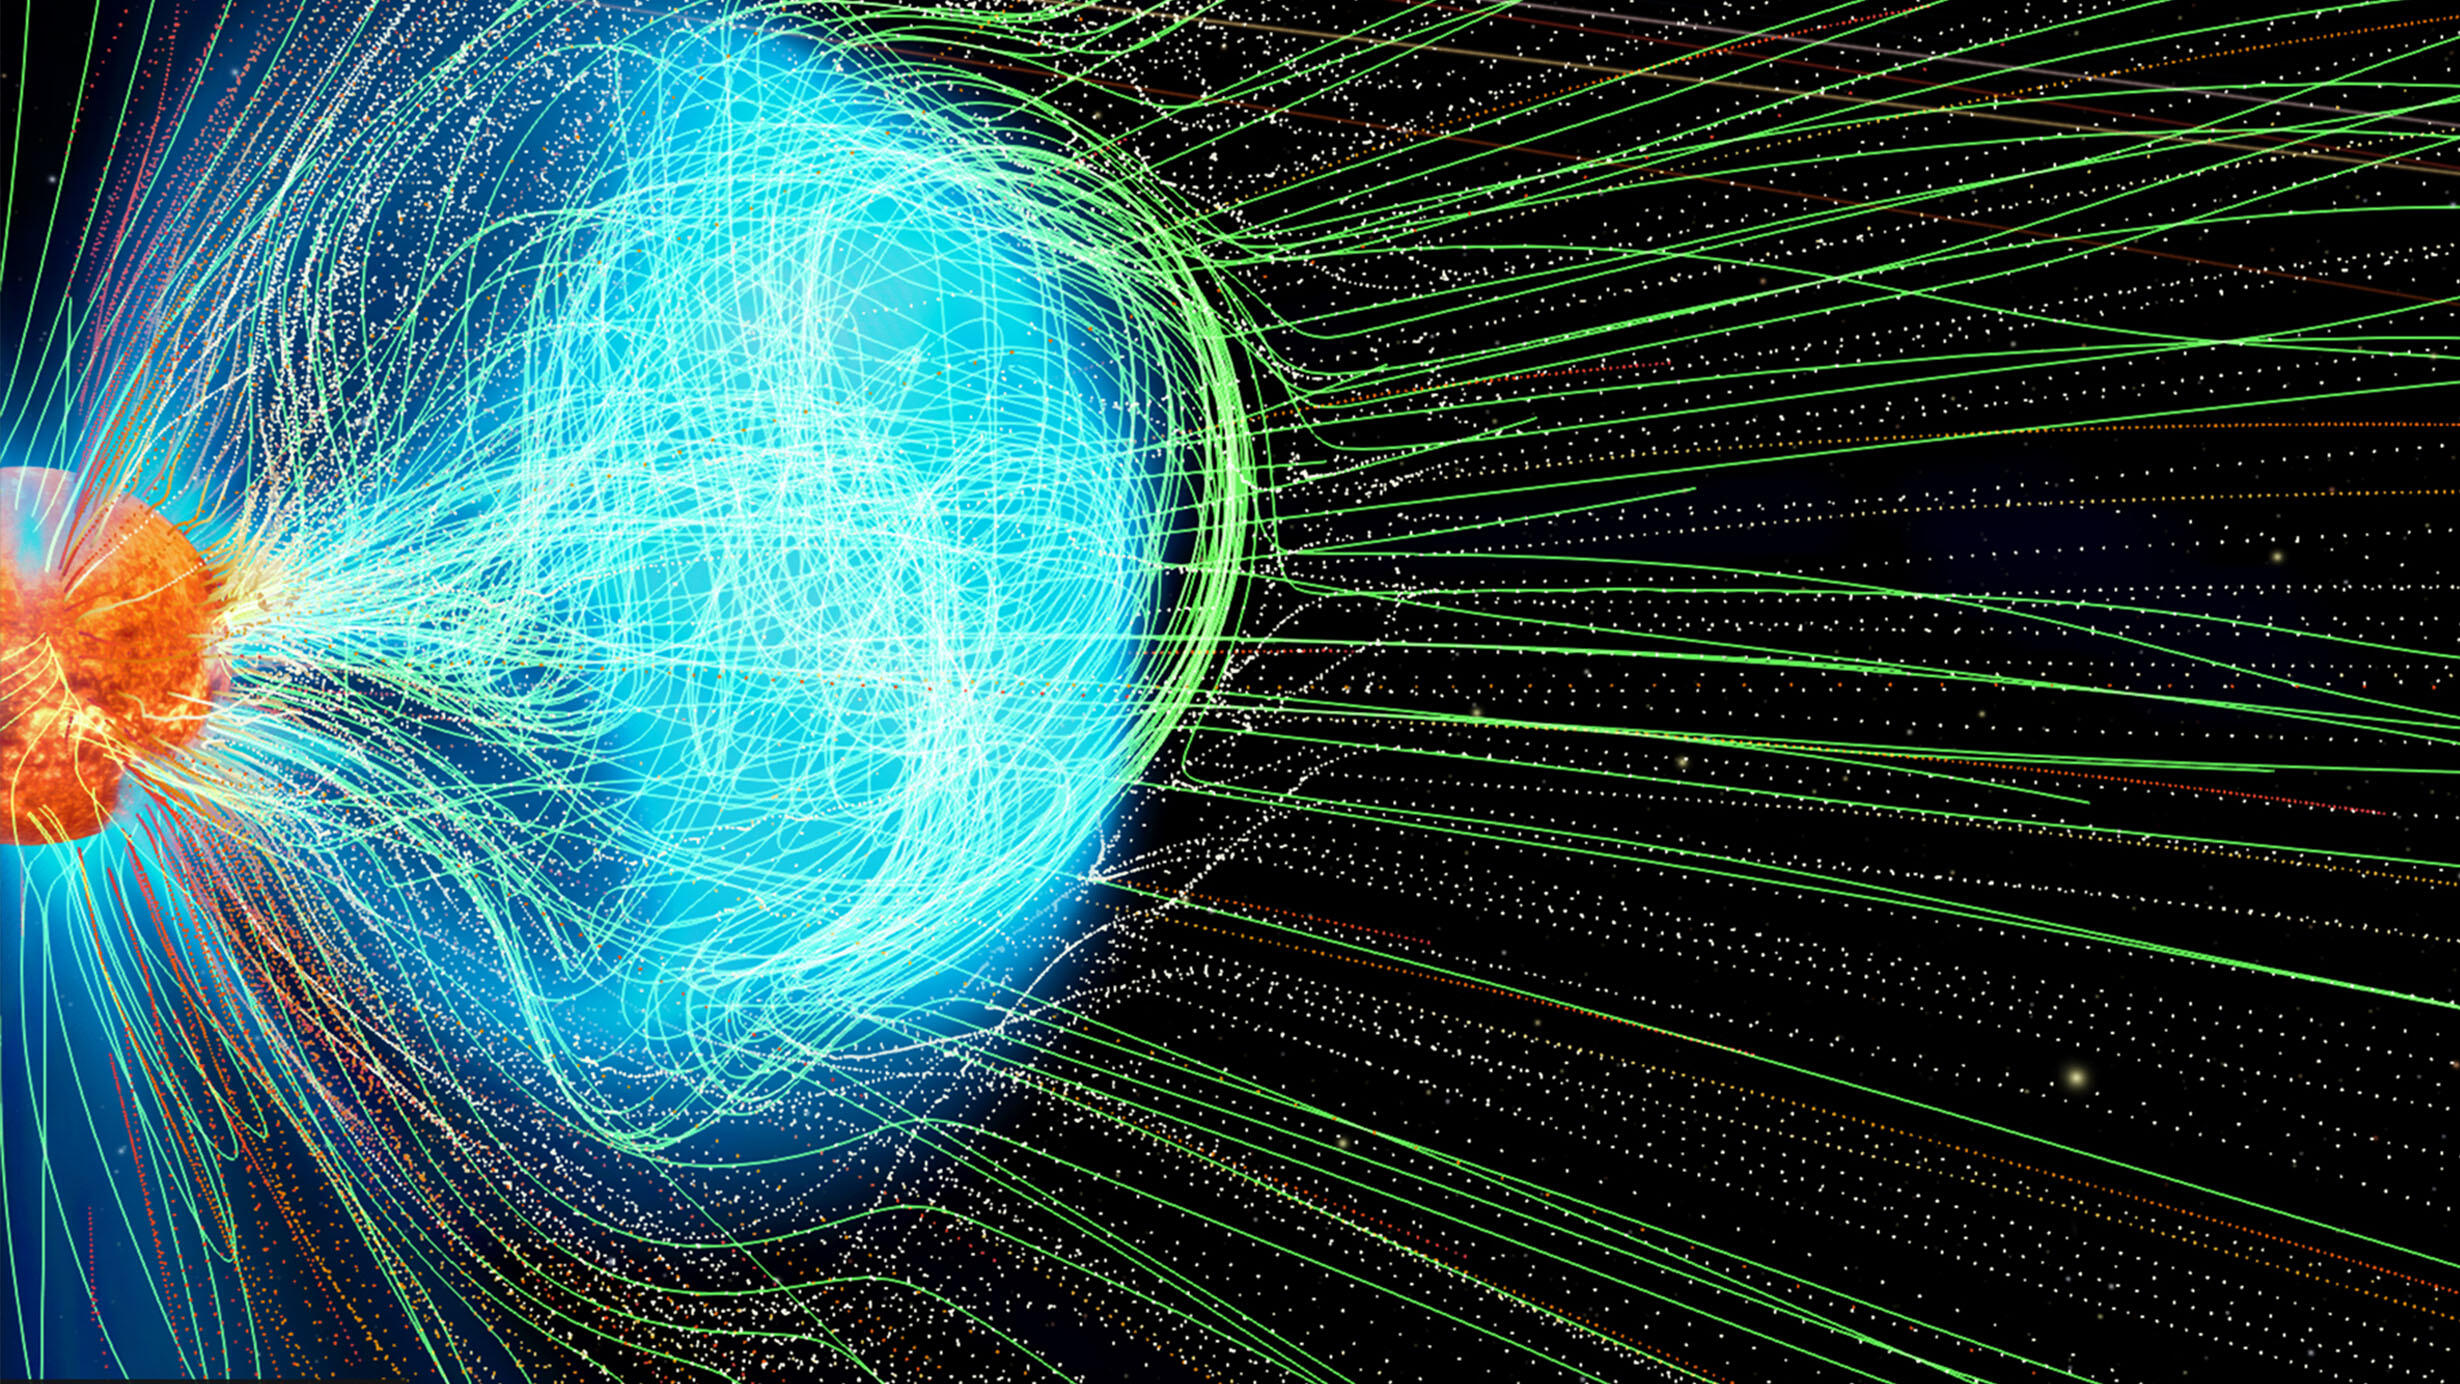
So Emilie, if we can turn on, please, the magnetic field of the Earth, we're going to see the Earth's magnetosphere. And so, we see that it pinches in the North and South poles. And it's like a bar magnet. If you've ever played with a bar magnet, with paper on top of it and iron filings, you see it traces out from one pole to the other. And that is what happens with Earth.
And we're going to be talking about this interaction from the sun's perspective. The sun throws things out, the solar boost. Other than solar storms, it also has this constant solar wind. And that's charged particles that come out from the sun. And they affect the magnetic field of Earth.
Now see how that tiny orbit of the International Space Station, very close to the Earth, is protected. It's underneath the shield of this.
How far is the moon? At this point-- well, you see the sun in the background there. So Emilie, if we could elevate above the Earth a little bit, so that we're looking down, and then we'll pull, we'll move away. We're going to sort of pull away from the Earth. We'll pull back. And as we do, we're going to see finally this orbit of the moon. And the moon is a quarter million miles away. 240,000 miles away. The International Space Station, 250 miles off of sea level on Earth. So you can think of a moon as being 1,000 times the distance of the International Space Station.
Well, you may have noticed, if you've ever seen a total eclipse of the sun-- I've seen two, and they're amazing-- that the moon moves in front of the sun and covers the sun. And when it does, we see its corona. So from the Earth, the moon appears the same size as the sun. But we now know that the sun is much farther away.
So now, if we move back away from the moon's orbit around the Earth, that's a trail. So we're sort of seeing that trail of the moon. We might be able to-- switch now to trails of the planets around the sun. So we'll pull away. We'll move back. We might bring back the moon's orbit. That's also possible. Thank you, Emilie.
And as we do-- let's move away from the Earth, if we can, please. And so, there's this tremendous distance. So with the Earth and moon appearing the same size from Earth, we actually now know that the sun is 400 times the distance. It's 93 million miles away from Earth and the Earth moon system.
We see other planets. Mercury in gray. And in orange, we see Venus. And then farther out, beyond Earth, is Mars. So Mercury goes around the sun in 88 days. And we go around in one year. It takes almost two years for Mars to go around. This simulation, or this, what we see right now, is set for a particular day Leila is going to talk to us about.
But the last thing I want to talk about is this tremendous distance. We also see-- this is going to be key to what we're talking about today-- is that light itself takes time to travel from the sun to the Earth. So we actually see the sun about eight minutes in the past. So, can we turn on the light time indicator here? And you may notice, up in the left corner, we're actually seeing that we've sped up time. And so, I think-- it's just about four-- yeah. It's about-- it's about four minutes per second. So if we count one second, 1/1,000, 2/1,000, it takes about two seconds. So, with this time speed up, we're actually seeing this indicator of, basically, light. That's the fastest thing we know. 186,000 miles per second. Moves out from the sun to us.
So, let's pull in closer to the sun. I'm going to hand this back to Leila, as she's the expert on this. She's going to walk us through some pretty amazing visualizations of simulations that have been done that allow us to understand the process of what's going on with these solar storms.
MAYS: Thank you, Carter. Yes, we're flying in close to the sun, because that will be the focus of our program today. And we rely on the sun to make life on Earth possible. But the sun also produces solar storms. And we're going to be looking at an interesting solar storm on July 14 in the year 2000.
When we say solar storm, that's an aspect of space weather. And space weather describes any sort of enhanced conditions in Earth's outer space environment and throughout the entire solar system. And the sun and its magnetic field control space weather. And we use satellites and images from satellites to help us study the sun, such as the Soho Observatory. So we're going to start--
EMMART: Leila.
MAYS: Go ahead.
EMMART: I've got a question, but it was something I think is a really good question. And Lucas Bush is asking, how big is the sun? I didn't mention that, but it's really big, right?
MAYS: Yes. So, you can fit-- I think it's about 109-- I think, Carter, you know the exact number.
EMMART: 109.
MAYS: Yeah. You can fit 109 Earths across the diameter of the Sun. So that really gives you an idea of the size. And I'll use that measure when we go into look at some sunspots. So let's actually bring up an image from Soho of the visible surface of the sun.
And what we're looking at there is the sun's visible surface. And those dark regions are called sunspots. And so, we just said, you could fit 109 Earths across the diameter of what you see on the screen there for the sun's size. But you can fit a few earths in those sunspots. If they're very big, you can fit more. So about one to a few Earths in there.
And those sun spots, those dark regions, are where the sun's magnetic field is especially strong. And they're more likely to produce solar storms from those areas.
So now we're going to look from Soho again. We're going to look at the sun's corona. So can you bring up the movie? It's a two day loop with July, just before our solar storm. And we're looking at all this activity of the sun's corona. This is just above the visible surface. But it's much hotter. And you can think of the sun's corona as its atmosphere.
And now, first thing to say here is that the sun isn't actually green. It is that orangey color that we were just looking at before. This is a false color image, because the wavelength being measured by the satellite here is not within the visible range. So you could actually make this any color you wanted. And we happened to just color the image green.
But you can see it's very dynamic. You can see there's these bright regions. And those bright spots are just above the sunspots we were looking at. And the sun has an activity cycle every 11 years, where the activity increases and decreases from maximum to minimum. And this is during solar maximum.
We're also seeing the swirling of this material that's called plasma. And plasma is hot gas that's so hot that it's-- the hydrogen and helium of the gas become ionized.
EMMART: Leila, we've got a question, which is right along with your mentioning of it. Isabella Valencia is asking, how hot is the sun?
MAYS: Yeah. So it depends what part of the sun you're looking at. So what we're looking at right now, that's a few million Kelvin. The surface, though, the orange sun that we were just looking at, that's about 5,700 Kelvin. And then the core, which is actually what's causing the ionized gas that's producing the plasma I was talking about, that's 15 million Kelvin. So it's so hot that the particles are charged. And they're charged. And they're flowing. They're churning like boiling water. And those flows, that's what creates the sun's magnetic field.
So now, let's look at the next video. This is a loop-- this next video is a loop of the event on July 14, 2000. It's a two day loop. And you're going to see a bright flash. And then you see the static. And this is going to loop. So you'll see this a few times. The bright flash is a solar flare. And the flare's an intense burst of light coming from the release of magnetic energy from that sunspot region. And they're very large explosive events. And it's basically a release of light at almost every wavelength on the spectrum. And that includes visible light. So you see that bright flash.
And the flares arrive at the Earth at the speed of light, which is about eight minutes, as you saw before. So the static, though, that you see, that happens just a little bit later. That's coming from energized particles, mostly protons. And they're accelerated by the solar storm. And then they hit the satellite's detector. And so, they travel at about the speed of light, about 30 minutes after the flare.
Now, the sun is always producing radiation. This is what we call sunlight. And we're mostly protected from the sun's radiation, from the atmosphere. The atmosphere filters that out for us. But when you have a solar storm like this, you have additional radiation from protons that are accelerated and energized. And what we saw in this beginning, with Earth's magnetic field, Earth's magnetic field protects us from that radiation. But the astronauts that are going to the moon, they will be impacted by these charged protons.
Let's zoom in to that region. We have a spill of a zoom in of that sunspot region. So that's where we had our flare. And you can see the zoom in there. And you can see this kind of twisted structure. This twisted thing, this slinky sort of thing. So what we're going to do now is we're going to go from here to a computer simulation. Go ahead.
EMMART: Yes. There's an interesting question here from Karen Emory. Why do so many storms arise in some spots? It looks like-- that's a good question.
MAYS: Yeah. That's a great question. It's because of the magnetic energy. The sunspots have higher magnetic field than the surrounding parts of the sun. And like I mentioned before, that plasma is churning and flowing. And so, the magnetic field of those sunspot areas is constantly moving and changing. And at some point, the energy builds up to a point where it becomes unstable. And you'll see that, I think, when we show you the visualization, how it suddenly explodes when you hit that instability point.
So Emilie, can you show us the sun's magnetic field and the magnetic field on the sun's surface? We're looking at the sun's magnetic field lines and the surface magnetic field. And remember, the sun's magnetic field is responsible for space weather. But it's invisible. So that's why we use these computer simulations to help us understand and see what's going on. And these field lines that you see, you can think of those as iron filings that would trace out the magnetic field that you would have, for example, from a bar magnet. So just imagine you have a giant bar magnet in the sun.
But it's a little more complicated than that. The sun's magnetic field is a little more complicated. So imagine a bunch of different bar magnets in the sun. And you can see where Emilie is zoomed in here--
EMMART: Leila, I just wanted to ask. Is-- because the sun is looking so much more complicated than the Earth, which is nice and symmetrical. I didn't mention, but the outer liquid core on Earth is fairly organized. And so I guess it creates a fairly stable dipole, like a North and South pole. Whereas the sun is kind of like a bad hair day, because it's gas? Or because it's plasma? Is that primarily why it's always churning?
MAYS: That's exactly right. It's because it's more complex because the plasma is constantly flowing and moving and churning. And then you have this activity that increases and decreases every 11 years with the churning flows.
In the blue-- I want to mention, the blue and the red that we see on the sun's surface here, those are the different magnetic polarities, like you would have in a bar a bar magnet, the positive and the negative. And we have a little bit more detail in this area here of the blue and the red areas, because that's where they want to accurately calculate the eruption.
And Emilie's flown us in really nicely, close to this slinky, spiral shape. That looks a lot like what we were seeing in the satellite images. So what we're going to do now, Emilie, if you could just play time for us, so we can see how this erupts from the sun. So you can see it starts to lift off and then it suddenly goes. So like, a sudden release of a twisted rubber band. These magnetic fields explosively realign, and they send out the magnetic field, and also, clouds of solar material, hurling into space. And that's what we call a coronal mass ejection.
And so, during a solar storm, the sun's magnetic field lines can be constantly realigning and changing, kind of like a bad hair day, like you were saying, Carter. And this time period, the reason why we're looking at this storm, July 14, 2000, is because it's one of the first solar storms that we were able to accurately study using computer simulations.
Now, Emilie, let's fly out a little bit further, like, let's zoom out a little bit, so they can see how this eruption goes out into space a little bit further away from the sun. And maybe we can also turn on the density. Let's show the density from the computer simulation. Maybe when we're-- fly out a little bit more, and then we'll turn on the density.
EMMART: One question that I found interesting here from Doug W. How strong is the sun's magnetic field? Because I guess we're looking at-- that sort of rubber band in the beginning was larger than the Earth. And is it much different? Is it stronger, effectively, than the Earth's magnetic field? That's a good question. I never wondered-- I never wondered about that.
MAYS: Yeah. Yeah. That is a good question. It's actually not that strong. So when you look at the surface, with those red and the blue areas, they're about as strong as the strength of a fridge magnet. So the strength isn't too high. Yeah. But it still carries a lot of energy in the magnetic field. Yeah. Of course, the magnetic field strength changes inside the sun. But that's at the surface.
So as this-- we turned on the density now. Emilie's turned on the density. And she's kind of flying us through this cloud that's coming towards us. And actually, this one does-- this eruption does travel toward the Earth. So if they're traveling in the right direction, they're moving so fast, they're moving at several million miles per hour, that they can arrive at the Earth in about 2 to 5 days. Now, this eruption was going 4 million miles per hour. And it hit the Earth just over a day later.
And the mass that you see here, the blue stuff that you see, that's material that has been erupted, and it's coming from the sun.
So solar storms actually have multiple parts. You have the flare that arrives at the speed of light. And then you have the protons, the radiation, that can arrive within 30 minutes. And then you have this cloud of material that can take a few days to arrive at the Earth.
EMMART: It really looks very dramatic. It's kind of scary, that the sun's sending these out.
MAYS: Right. Right. But we should remember that that magnetosphere, the Earth's magnetic field, does protect us from a lot of the effects of the solar storms. But the astronauts, they're are not as protected, because they're going to be going to the moon. So Emilie, let's get a little bit closer to the sun, and let's show the audience the proton intensity from the computer simulation. And let's fly out a little bit so they can see that a little bit better. Yeah. There we go.
So, those circles that you see there, those are indicating the locations where the energized protons are calculated from the simulation. And they move out with the solar wind. That's the material that the sun is always sending out. And Emilie, can you turn on the color bar? So we have a color scheme here for the proton intensity, going from like the lower intensity-- the black, the purple-- to the higher intensity-- red, orange, yellow, and then the white.
And intensity-- yeah, let's keep flying out and show more of the proton intensity. Intensity is a measure of the amount of protons over time in a given area. So during a storm, a proton storm, think about it as a rainstorm. Like, how many rain droplets are hitting your umbrella during a rainstorm? If you have more droplets hitting your umbrella per second, then it's a stronger storm. So it's the same idea here with the intensity.
EMMART: It's really amazing to me, Leila, because, you know, it just lights up. And then we see this sort of evident explosion. But this is, in that way, it's even scarier than just seeing that explosion, because we're seeing these highly energetic protons, which I guess are the radiation that our bodies don't want to encounter.
MAYS: Exactly. Exactly. We don't want-- you don't want to encounter these charged particles, because they're high energy. And they're accelerated by that eruption, and they can be accelerated to high energies. What we're showing you today is the higher energy ones, the protons that are moving faster, because those are the ones that are of the most concern for astronauts.
And I believe now Christian is flying us. And Christian, can you zoom out a little bit more, and we'll turn off the density? And we talked about how these protons are moving so fast, almost at the speed of light, and they're hard to predict because of that. So just like volcanoes and earthquakes on the Earth are hard to predict, these eruptions also are difficult.
EMMART: Could we see that speed of light indicator again?
MAYS: Yes. Let's turn that on. Yeah. That would be great. So you can see that little blip coming from the sun. So that's how fast the flare light will reach the Earth. And then you can see the--
EMMART: Why is it all spiraling away from the sun?
MAYS: Right. Right. So the spiral is because while the sun's sends out its material and magnetic field into the solar system, it's rotating. So because it's rotating, you get the spiral pattern. So imagine a rotating sprinkler, or if you were holding a garden hose and rotating, the water would form a spiral pattern. So that's the spiral that we see there.
And these protons are traveling along the spiral magnetic field lines. You can think of them as particle highways. And they're traveling really fast on these particle highways, and they can arrive within 30 minutes. So you can see a few blips from the speed of light indicator there, and then you can see that intensity increase is already making it over to the Earth.
EMMART: Actually, there's-- Krishna Prasad is asking, do protons move through the magnetic field lines? And this notion of "through the lines"-- I guess this sort of confused me, too, when we were talking about this initially.
MAYS: They don't move through the lines, but they move around the lines, because they're charged particles. All charged particles will move in this sort of like spiral motion around the field lines. So they're kind of-- the field lines guide them along the particle highway.
It's very important for us to try to protect astronaut health from this radiation for the success of our human exploration missions, because astronauts that have too much radiation exposure can experience nausea and fatigue, and that can impair their ability to complete their mission tasks. So the overall goal is to make sure that their radiation exposure level is as low as reasonably achievable.
EMMART: So let me just see if I understand this properly, Leila. What we have is essentially this spiral sort of form that we see in front of us, but these are essentially an array of-- we can think of them as detectors. And thus, we see that the intensity level over on the right. And that's sort of been placed by the model. Is that correct?
MAYS: Right. Exactly. The computer simulation has all-- everywhere where you see color is where the computer simulation has actually calculated the proton intensity. And the calculation travels out with the solar wind, so that's why-- and the magnetic fields. So the calculation traces out the sun's magnetic field as it goes out and forms the spiral.
And actually, we're going to look at the intensity in a slightly different way. Christian, yeah. Could you bring up this intensity plane? So this is the sun's equatorial plane. We're looking at the intensity only in that plane. You'll start to see the intensity grow and come toward the Earth right behind that speed of light indicator. This is just another way to look at it. It's the same simulation. And you can also-- this helps us see how widespread the proton radiation is. It's covering almost half of the inner solar system.
So for-- when we think about human exploration, these events are important no matter where you're going.
EMMART: So first, we're hit by the low energy stuff, but then, as time evolves, we're sort of bathed in the higher energy levels. That's pretty scary.
MAYS: Right. Right. In this case, the higher intensity. Yes. And remember, we're speeding up time. So we've been showing-- most of the time, we're speeding up time to about four minutes per second, because we don't want to wait around eight minutes for that speed of light blip to come to the Earth.
But let's look again at where the proton intensity was calculated with the little circles. And let's fly into the Earth and moon system. And get in-- let's get an idea of what it would be like for an astronaut during one of these events. So we're going to--
EMMART: When we fly in here, when we just start to see the moon's orbit there around the Earth, that's the furthest that humans have ever been. So if we go to Mars-- we can see that Mars is on the opposite side of the sun, if we're on a Mars mission. That's pretty far away.
MAYS: That's right. That's right. And so now, we're seeing this. The protons coming towards us. You can see the intensity increase coming toward the Earth. This is the radiation level that an astronaut would experience during a storm like this one. And you know, forecasting these are very difficult, because there is a lot of activity during this time. There was a lot of flares. There were a lot of eruptions. But not all of them produced energized protons. So the challenge in making these forecasts is, which of these solar storms would produce the protons? And how intense will they be? But also, which ones will not? And forecasting those radiation-free periods, known as all clear periods, is also really important for protecting astronauts.
And so now, I think we want to look-- we talked a little bit about how we are protected on the Earth. So let's take a look at our magnetosphere again.
EMMART: Actually, we have a question from Patrick Ferrante. He's in the sixth grade, from Long Valley. Wants to know how the intensity of radiation will impact astronauts on a mission to Mars compared to Earth or the ISS. So I guess this is really setting us up for, again, looking at the Earth's magnetic field that really sort of protects us. But not on a moon mission, at least for, I guess, ISS.
MAYS: That's exactly right. Right. And actually, Christian, can you turn on-- can you highlight for us just the intensity that's closest to the Earth? So that we can see that's the type-- that's the intensity that would matter for a mission going to the moon. We'll see the event coming toward us. And I think we can speed up time a little bit, maybe 15 minutes per second, to see the full event. Yeah. So you can see, we've highlighted with a little bit-- the circles near the Earth are a little bit brighter.
Yeah. Let's fly into the magnetosphere. And maybe, Carter, can you orient us and talk to us about the scales?
EMMART: Sure. Sure. What's interesting-- of course, the moon-- farthest any anyone has ever been on. Almost 50 years ago. We're going back there, which is great. You can see that the moon kind of goes in and out of this magnetic tail, the geomagnetic tail. But also, if we come in a little closer-- Christian? Yeah, great. Christian's flying now. And can we spin around to the other side, the sunlit side? Just kind of move around this. That's great.
Way down, sort of almost stuck to the Earth, we see the orbit of the International Space Station. But we also have communications satellites. Once again, the altitude above sea level of the ISS is 250 miles. And now, we're looking at satellites. These are our communications satellites that we place primarily above the Earth's equator. We could come a little closer, please. And we see them all parading around the Earth here. And at 22,500 miles or so, their--
I should mention, the International Space Station goes around the Earth every 90 minutes, which is amazing. Very, very fast. 17,500 miles an hour. But farther out, the orbit is slower. And so, we go around the moon. Sorry. Go around the Earth in 24 hours at that-- so that's 22,000 miles. And that's 1/10 the distance to the moon. Moon goes around even slower. It goes around the Earth in one move or one month, give or take a couple days. Of course, we had a beautiful full moon last night, if you saw it. So that gives you a sense of scale. And I guess this-- actually, this is kind of a static shape. We're not showing this dynamically, the magnetosphere.
MAYS: That's right. And maybe we can turn on the moon orbit, the lunar orbit. And we can see that it's outside of this magnetic bubble. So like an umbrella, this magnetosphere protects us from the proton radiation. The astronauts they're going to the moon are not protected. They they're mostly outside. Sometimes they go through the tail, but really, not. For a long time period. So most of their time is going to be spent inside of their spacecraft and the spacecraft does have some shielding.
EMMART: I just mention this, Leila, that Elon Olson asks, why are we looking at 20 year old data? And he said he's asking for his father. But-- I'm wondering that, too.
MAYS: Right. We're looking at this event because it was a strong proton storm, and it was one of the first ones that we could simulate from the sun to the earth, and understand with the computer simulations. And also, it's a really good example of, if you had this type of proton storm during a mission to the moon, this would be the type of event that they would be worried about.
One way that they can help lower the risk to astronauts is what they do inside of their spacecraft. The more material you put between yourself and the charged protons, the better. So we actually have a quick video of a mock-up of astronauts showing-- if you can bring up that video of the cargo from the Orion spacecraft. So this shows you how, if one of these events happened or is forecast to happen, the astronauts can go into the cargo bay. And they can put all the different equipment and supplies around them, to try to lower their radiation exposure. Because the spacecraft and this equipment can provide some shielding for them. They're basically building themselves a radiation shelter.
So the lower-- this can help shield out the lower energy particles. But the higher energy particles might still get in. So the more stuff you have around you, the better.
EMMART: On a Mars mission, as well, you'd have to do a similar thing, get enough mass or--
MAYS: Exactly. And going to the moon-- we had that question earlier-- going to the moon is very similar to going to Mars, because the moon and Mars both don't have magnetospheres. So you don't have that protection.
All right. So we're back here, looking at the proton intensity. And I just want to mention, there's another risk to the astronauts when they're in EVAs. Extravehicular activities. When they're outside of their spacecraft, all they have is the shielding from their spacesuit, and that will only shield some of the protons. So there's definitely higher risks there.
And so, radiation exposure is definitely one of the important things to consider when planning human spaceflight missions. And computer simulations like this one, in combination with radiation monitors that they're going to use on the spacecraft, the shielding from the vehicle, the spacecraft, the mission operations-- these are all ways that they will lower the radiation exposure to be as low as reasonably achievable for the astronauts.
EMMART: Well, I really want to-- I want to thank you, a wholehearted thank you, because working with you and your team, and also John Laker simulation from Predictive Sci has been tremendous. But I really want to give a tremendous shout out to our students here, Christian and Emilie, because they've made this visible for us. This has been a fantastic internship. They did their master's thesis on this. I want to thank everybody who had very good questions today. I'm sorry we didn't have a chance to answer everybody's. But it's been an exciting program for me to see. Bye bye.
Dr. Leila Mays is the deputy director of the Community Coordinated Modeling Center (CCMC) at NASA Goddard Space Flight Center. Her research interests include modeling the heliosphere and solar energetic particles, performing model verification, and forecasting space weather. She received her BS degree from the University of Maryland College Park, and PhD degree from the University of Texas at Austin.
Stay in the loop for more upcoming events—sign up for our newsletter.
Creation of this solar storms program was made possible in part by funding under the project “Quantifying the Risk of Extreme Solar Eruptions” (QUEST) in the National Science Foundation’s Prediction of and Resilience against Extreme Events (PREEVENTS) program and by the Community Coordinated Modeling Center Space Weather Research, Education and Development Initiative (REDI), also funded by the National Science Foundation.
Science results described in the show supported by NASA under the LWS, HSR, and SBIR/STTR programs, and by the Air Force Office of Scientific Research.
Scientific contributors: Jon Linker, Tibor Torok, Ronald Caplan, Cooper Downs, Roberto Lionello, Pete Riley, and Viacheslav Titov (Predictive Science Inc.); Nathan Schwadron, Matthew Young, and Matthew Gorby (University of New Hampshire)
CCMC contributors: Emilie Ho and Christian Adamsson (Linköping University and CCMC master’s students), Masha Kuznetsova (magnetosphere scientist and CCMC Director), Leila Mays (CCMC SEP scientist and CCMC Deputy Director), Elon Olsson (CCMC OpenSpace developer), Lutz Rastaetter (CCMC geospace scientist). Peter Macneice (CCMC Solar scientist). Magnetosphere simulation: Space Weather Modeling Framework (University of Michigan).
OpenSpace team contributors: Lovisa Hassler, Alexander Bock, Jonathan Grangien, Matthias Berg, Oskar Carlbaum and Michael Novén.
NASA Johnson Space Center Space Radiation Analysis Group contributors: Janet Barzilla, Phil Quinn, Michael Cook, Clayton Allison (Leidos) and Katie Whitman (University of Houston).