It was seen for just 14 days before fading from view. From these ancient records, modern astronomers determined that what the ancient astronomers saw in 1437 was a nova explosion, but they had been unable to find the binary star system that caused it—until now.
© K. Ilkiewicz and J. Mikolajewska
A new study published today by the journal Nature pinpoints the location of the old nova, which now undergoes smaller-scale “dwarf nova” eruptions. The work supports that idea that novae go through a very long-term life cycle after erupting, fading to obscurity for thousands of years, then building back up to become full-fledged novae once more.
“This is the first nova that’s ever been recovered with certainty based on the Chinese, Korean, and Japanese records of almost 2,500 years,” said the study’s lead author Michael Shara, a curator in the Museum’s Department of Astrophysics.
A nova is a colossal hydrogen bomb produced in a binary system where a star like our Sun is being cannibalized by a dead star, known as a white dwarf. It takes about 100,000 years for the white dwarf to build up a critical layer of hydrogen that it steals from the sun-like star, and when it does, it blows the envelope off, producing a burst of light that makes the star up to 300,000 times brighter than the Sun for anywhere from a few days to a few months. (This 2007 NASA animation below shows an artist's concept of Z Camelopardalis (Z Cam), a stellar system featuring a collapsed, dead star, or white dwarf, and a companion star.)
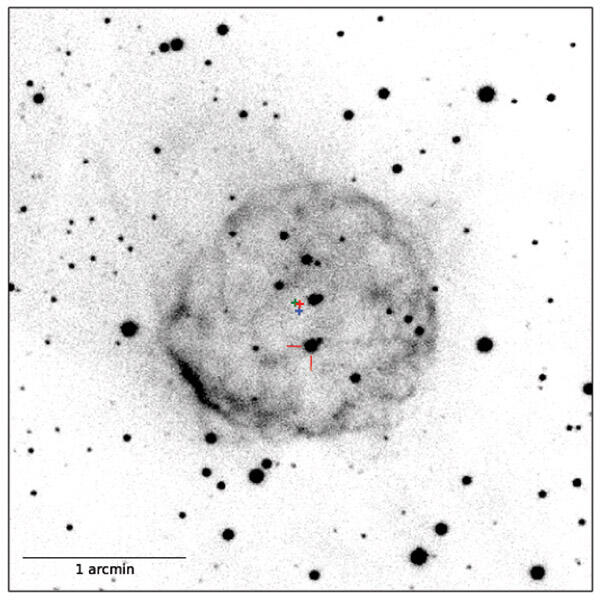
For years, Shara has tried to pinpoint the location of the binary star that produced the nova eruption in 1437 along with Durham University’s Richard Stephenson, a historian of ancient Asian astronomical records, and Liverpool John Moores University astrophysicist Mike Bode. Recently, they expanded the search field and found the ejected shell of the classical nova. They confirmed the finding with another kind of historical record: a photographic plate from 1923 taken at the Harvard Observatory station in Peru and now available online as part of the Digitizing Access to a Sky Century at Harvard (DASCH) project.
“With this plate, we could figure out how much the star has moved in the century since the photo was taken,” Shara said. “Then we traced it back six centuries, and bingo, there it was, right at the center of our shell. That’s the clock, that’s what convinced us that it had to be right.”
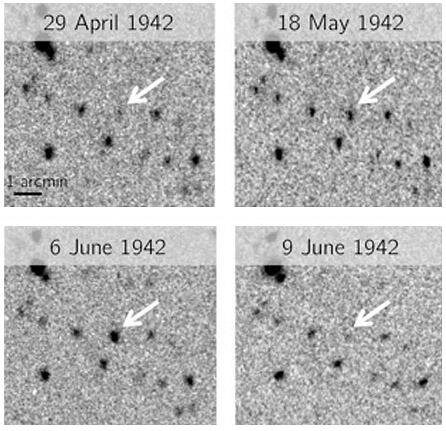
Other DASCH plates from the 1940s helped reveal that the system is now a dwarf nova, indicating that so-called “cataclysmic binaries”—novae, novae-like variables, and dwarf novae—are one and the same, not separate entities as has been previously suggested.
After an eruption, a nova becomes “nova-like,” then a dwarf nova, and then, after a possible hibernation, comes back to being nova-like, and then a nova, and repeating the cycle up to 100,000 times over billions of years.
©Harvard DASCH
“In the same way that an egg, a caterpillar, a pupa, and a butterfly are all life stages of the same organism, we now have strong support for the idea that these binaries are all the same thing seen in different phases of their lives,” Shara said.
“The real challenge in understanding the evolution of these systems is that unlike watching the egg transform into the eventual butterfly, which can happen in just a month, the lifecycle of a nova is hundreds of thousands of years. We simply haven’t been around long enough to see a single complete cycle. The breakthrough was being able to reconcile the 580-year-old Korean recording of this event to the dwarf nova and nova shell that we see in the sky today.”
Learn more about how astronomers, including Shara and his Museum colleague Ashley Pagnotta, peer back into time using the DASCH project, below.
ASHLEY PAGNOTTA (Davis Postdoctoral Fellow, Department of Astrophysics): In astronomy, things either happen almost instantaneously, or over tens of thousands, millions of years. But one of the things that we’re starting to learn is that the things that we previously thought were constant over a hundred years, we’re seeing changes over decades—essentially the course of a human lifetime.
My name is Ashley Pagnotta. I am a Kathryn Davis postdoctoral fellow at the Museum of Natural History. I research stars that explode and I teach future teachers.
[SHELF LIFE TITLE SEQUENCE]
PAGNOTTA: One of the differences between astro collections and natural history collections is that because ours live on hard drives, instead of in cabinets, they take up a whole lot less room. Theoretical and computational astrophysicists run these enormous simulations. So their collections are the outputs of those simulations.
For me, because I’m an observational astronomer, my collections are images.
Now, when we take pictures of the sky, we use basically digital cameras. Before we had that technology, we used glass plates that were coated with a photo emulsion. They would be put onto the end of the telescope, exposed like film, and then developed. And the advantage of this was that they, for the first time, had an objective record of what the sky looked like.
The Harvard Plate Collection is the largest in the world—about half a million glass plates. They date all the way back to 1890. Harvard had telescopes all over the world, and they would do what we call sky patrol—basically, take pictures every night in an organized fashion so they could cover the whole sky. And then they would regularly repeat that, so they could look for things that were changing.
MIKE SHARA (Curator, Department of Astrophysics): Once we had a permanent record on photographic plates, we knew that we could go back a week later, a year later, a century later, and in some sense, recover what galaxies, stars, and so on were like during those observations.
My name is Mike Shara. I’m a curator of astrophysics here at the American Museum of Natural History. What I do is exploding stars.
I can’t send a time machine into the past. We simply have one record of the universe streaming by us, and because the astronomers a century and more ago were snapping pictures, we have a continuous record over an enormously long period of time.
It’s a completely unique history and digitizing their collections is very, very high on the wish list of most of the world’s astronomers.
PAGNOTTA: Harvard has started a scanning program and here at the Museum, we’re also working to help bring the plates into the modern era and to make them more available to us, for the science that we want to do, but also to the broader astronomical community.
So, one type of star that I’m interested in is called a Cepheid variable, and these were discovered by Henrietta Leavitt who worked at the Harvard Observatory in the early 1900s.
She realized that you can use these Cepheid variables to measure distances. Which is really useful because we can’t just stretch a yardstick halfway across the galaxy.
Leavitt in the early 1900s compiled a catalog of all these variable stars in the Large and the Small Magellanic Clouds—mini-galaxies that are actually gravitationally bound to our galaxy, the Milky Way. Later in the 1950s and ‘60s, Cecilia Payne-Gaposchkin updated Henrietta Leavitt’s catalog. So, we have these two fantastic catalogs that are crucial to measure distances.
But we went to look for them in our modern digital catalogs of stars and they weren’t there. So, what we decided to do with a couple of groups of high school students who work here through what we call the SRMP program—the Science Research Mentorship Program—was to update those catalogs.
JULIA KRUK (Science Research Mentoring Program Student): My name is Julia Kruk.
ZACHARY MURRAY (Science Research Mentoring Program Student): I am Zachary Murray. We participated in the SRMP program.
Essentially, they were taking pictures of the sky and printing them on photographic plates, and then Henrietta Leavitt used an X-Y coordinate system to chart the locations of the stars.
What we start with is a sheet with columns of numbers on it. But these positions were only valid for the era in which she did her observations.
KRUK: We had to make sure that it was accurate so we could find these stars today.
MURRAY: So, in order to correct that, we converted those X-Y coordinate positions to modern spherical coordinates.
PAGNOTTA: But they weren’t quite as modern as we use today. Because the Earth kind of wobbles on its axis, that means where we see the stars changes very slightly over time. So, the next step was they had to what we call precess them all the way forward. So, they actually wrote a computer program to get modern coordinates.
KRUK: We’re publishing this data and making it available to the astronomical community— a century’s worth of data in one location.
SHARA: It’s one thing to collect and to generate data. It’s entirely another thing to make sense of it. And that’s what makes it more and more scientifically valuable. By involving a team of students who are willing to get their hands dirty and look at the data, we begin to train the next generation of scientists and at the same time, selfishly, we get something out of it.
PAGNOTTA: Once this catalog is complete—and it’s almost finished—we will have a digital, fully accessible catalog that anyone in the world can use. And then from there, you can start to do science—see how do these stars change over time. We think that they probably do change over 100 years, but we don’t really know what they do. Nobody’s ever looked before.