Investigating and Graphing Salinity Data
Part of the Ecology Disrupted Curriculum Collection.
DOWNLOADS
How to Represent Data lesson plan
How to Represent Data investigation booklet
LESSON PLAN
(Time required: about 45 minutes)
1. Reintroduce Dr. Sujay Kaushal’s story (6 minutes)
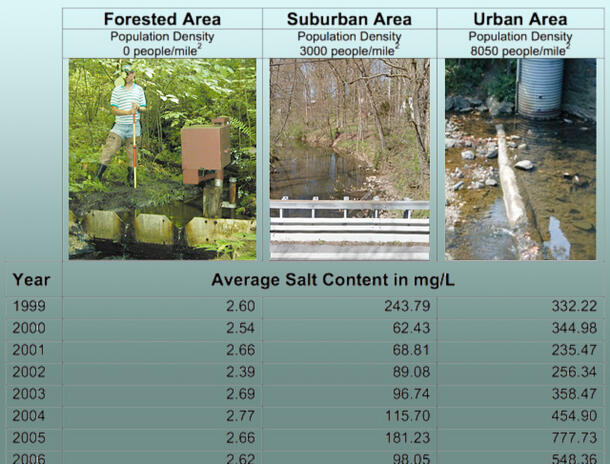
Reintroduce Dr. Kaushal's story with the following quote from the video: “Water is the reflection of all the bad water quality things we do one land.” Relate quote to why Dr. Kaushal tested streams in forested areas.
2. Distribute the complete datasets to the class and lead a discussion (20 minutes)
Distribute the complete datasets to the class and lead a discussion about the difference in the three areas, and why it is important for the class/scientists to look at data from forested, suburban, and urban water areas.
3. Present slide show, which begins with a discussion of how population density impacts salt levels (20 minutes)
4. Complete the How do you investigate and represent data? section of the Investigation Booklet (5 minutes)
Summary/Assessment: Ask students to complete the How do you investigate and represent data? section of the Investigation Booklet, available in the Downloads section on this page.
5. After completing the Investigation Booklet, students can begin setting up graphs to represent their data for the rest of the period (10 minutes)
Note: Students will continue graphing in the next lesson.