Setting Up Graphs
Part of the Ecology Disrupted Curriculum Collection.
DOWNLOADS
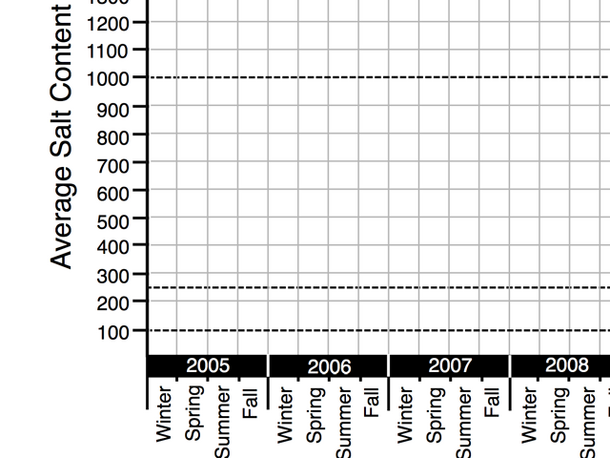
Salt Level Data Graph templates
Setting Up Graphs teacher's guide
TEACHER'S GUIDE
If they don’t already have the datasets, distribute the complete datasets to the class, from the “How to Represent Data” activity.
Graphing Directions – A guide to group work on the graphs
- Hand out the graphing template to each group of 4, which is prepared with a preset scale and a benchmark from the salt and ecosystems case study.
- Assign each student one of the datasets: 1-forested, 2-suburban, 3-urban, and 4-annual data.
- Before graphing ask students to use the salt and ecosystem case studies (see the “Salt and Ecosystems” activity) to add 2-3 more benchmarks onto their graphs. The students can use the sample benchmark as a guide for how to put the benchmarks onto the graphs.
- Groups can choose a bar or line graph, but each person in the group must do the same type of graph for ease of comparison.
- Ask students to fill in different population density levels for each area, which can be found on their datasets on the top of the graph next to the key.
- Ask students to choose the appropriate check boxes in the title
- Pick one checkbox for annual or seasonal
- Pick all checkboxes that apply for forested, suburban, and urban streams
- Remind students to individually label their lines or bars, if they are plotting data from more than one stream on their graphs (e.g. the annual dataset includes data from forested, suburban, and urban streams).
- Check student work.
- Ask students to begin graphing. If a student finishes early, they can begin to graph other datasets onto their graph.Note: Make sure students delineate between the different datasets by using different colors or style of lines.
Scaffold – Rounding Numbers
Some students might need help determining how to round off numbers. For more instruction on rounding, try these websites:
Math is Fun, Rounding Numbers
http://www.mathsisfun.com/rounding-numbers.html
My Schoolhouse — Rounding Numbers
http://www.myschoolhouse.com/Teachers/Resources/rounding%20numbers.htm
Tips for Graphing
It is important for the students to complete the graphs correctly because their analysis hinges on the correct plotting of their data.
- When students plot the salt and freshwater benchmarks, they should use a straightedge to draw a straight line at the correct level of salt.
- When student groups choose to do a line or bar graph, make sure that everyone makes the same type of graph for ease of comparison.
- Ask students to complete the graph in pencil first and check their points before having them connect their lines or create their bars.