Additional Case Studies: Materials Contributed by Teachers
Part of the Ecology Disrupted Curriculum Collection.
Here you will find additional lesson plans and data analysis activities, which apply the Ecology Disrupted pedagogical strategy—using the environmental impacts of everyday human behavior to illuminate ecological principles.
Data Analysis Activities
This section contains data analysis worksheets created by teachers. Use them as data analysis assessments or to illustrate ecological functions.
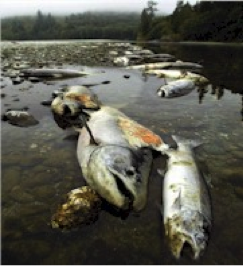
Salmon and The Klamath River Dams The Klamath River is an important river for fish migration. Each year millions of fish swim upstream to spawn in the river's freshwater regions. The river is also home to many hydroelectric power plants. In 2002, a massive fish die-off occurred, killing tens of thousands of Chinook salmon. Scientists analyzed water temperature, water flow and fish run size to determine the cause of this die-off. Students will analyze the same data to generate an understanding of the important and sometimes controversial role renewable energies play in disrupting an important component of the water cycle, the return of water from rivers to the oceans. Salmon and The Klamath River Dams Downloads |

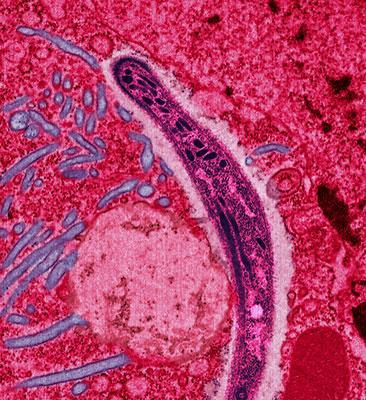
Hantavirus and Human Health Hantavirus is a rodent borne disease of the heart and lungs that is very deadly when passed onto people. Since some rodent species are more efficient carriers of the virus, scientists thought that the reduced biodiversity brought on by forest loss may increase the prevalence of the disease. To test this hypothesis, scientists compared the prevalence of hantavirus in rodents in forest plots that they manipulated to have few rodent species (experimental) to forest plots that they did not touch, i.e. with many rodent species (control). The data presented in the two graphs allow the students to analyze and demonstrate their findings. See the Science Bulletin: Biodiversity Boosts Human Health Hantavirus and Human Health Downloads |

Algae Diversity and Clean Water Recently scientists conducted a lab study that showed that a more biodiverse community of algae is more efficient at removing excess nutrients from water. Changing stream environments can make streams less hospitable to some algae species, leading to fewer algal species that are less efficient at removing excess nutrients. See the Science Bulletin: More Species, Better Water? Algae Diversity and Clean Water Documents Downloads |

White Nose Syndrome and Bats A new fungus has been spotted that is harming bats. Bats with this white fungus on their noses show uncharacteristic winter behavior. Normally, bats hibernate in winter to survive the season when very little food is present. Bats with this fungus have been found flying during the day and during winter. They also have low body fat, making survival difficult. It seems to be responsible for declining bat populations across the United States. See Science Bulletin: Bat Sickness Spreads to New States White Nose Syndrome and Bats Downloads |

Acid Rain Acid rain is a growing environmental issue that stems from the coal plants we rely on to produce electricity for daily activities like lighting your home or powering your cell phone. Scientists researched the relationship of emissions from coal burning, acidification of Adirondack lakes and rivers, and fish species abundance. Through charts and graphs, students will learn about the water cycle and be able to connect it to the correlation between coal plant emissions, acid rain and acidification, and decreasing number of fish species in the Adirondack region. Acid Rain Downloads |

Understanding the Ozone Through different activities and data analysis, students will be able to understand the importance of ozone in our atmosphere, how ozone depletion occurs and how humans play a role in its depletion. Students will also have the opportunity to discuss the effects the 1987 Montreal Protocol has had on the atmosphere. Ozone Downloads |
The Relationship Between DDT and Malaria Through data analysis, students will be able to analyze the relationship between malaria, DDT and insecticide-treated netting. Students can relate this information to abiotic and biotic factors, energy flow through ecosystems, and how humans affect these ecosystems. Malaria Downloads |
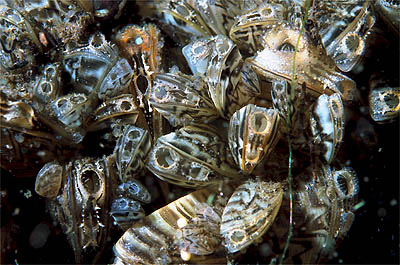
Zebra Mussels: An Invasive Species Zebra mussels are an invasive species that were brought to North America via ocean-going ships and are rapidly changing the Great Lakes and Hudson River ecosystems. Through data and graphs, students will be able to understand the effect zebra mussels have on many different species and construct food webs of ecosystems with and without zebra mussels present. Zebra Mussel Downloads |

Yellowstone Food Webs In 1992, Yellowstone National Park reintroduced wolves into the local ecosystem. This reintroduction affected the elk population as well as its food source, the aspen population. Students will use data and graphs to better understand trophic levels and the importance of key species in ecosystems. Yellowstone Downloads |

Urban Birds Birds living in cities are living in different ecosystems than their forest-dwelling counterparts. One team of researchers wanted to understand the affect of artificial light at night on bird reproduction. They compared the reproductive cycles between city and forest-dwelling blackbirds to understand when blackbirds were reproducing and for how long. Students will walk through data to understand the research question, the experimental design and the research outcome. Urban Birds Downloads |
.jpg#mediaviewer/File:Common_Blackbird_(turdus_merula).jpg)